


What inflation data actually tells us

There is a fundamental collision between the economy on paper and the economy at the grocery store. When the government announced on August 11 that inflation had eased to 8.32 percent -- its lowest point in eight months -- the number was not greeted with relief, but with immediate suspicion. Sceptics cried data manipulation, while the finance minister rushed to defend the math. Yet, lost in this crossfire is the actual anatomy of the number itself, which explains why a supposedly positive economic update can feel so entirely disconnected from reality.
Unlike Gross Domestic Product (GDP) growth or trade deficits, inflation is an intimate statistic. It dictates survival. It is felt every time a family buys rice, pays for cooking oil, or boards a bus. This burden falls overwhelmingly on lower-income households, who spend the vast majority of their earnings on unavoidable necessities and have no luxury expenses to cut when times get tough. Because every citizen can instantly audit the government’s claims against their own daily survival, inflation figures are politically combustible everywhere in the world.

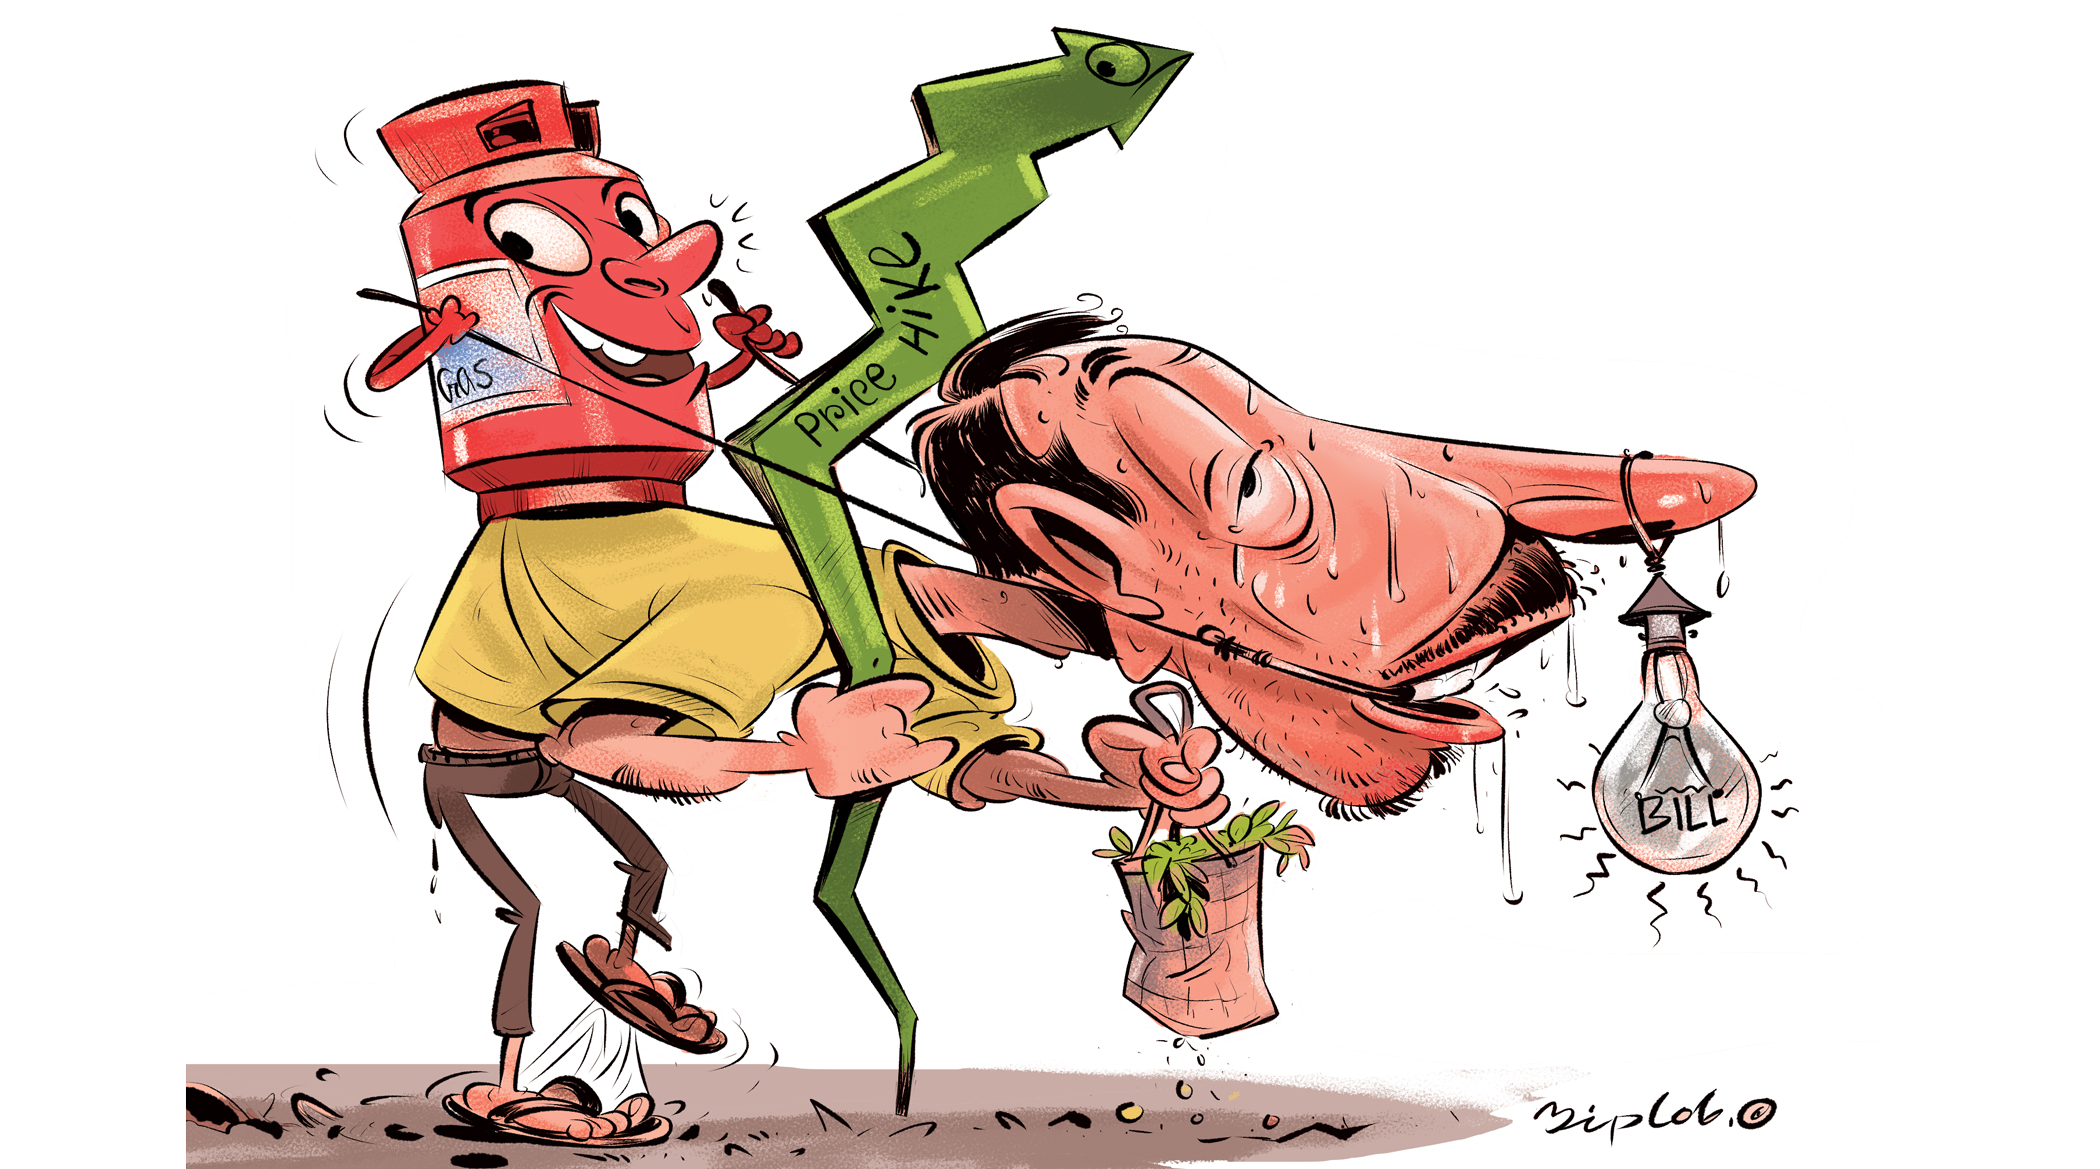
The fiercest outrage over this month's data stems from a basic misunderstanding of what a slowing inflation rate actually means. A drop from 9.16 percent in June to 8.32 percent in July does not mean the cost of living went down. It simply means prices are getting more expensive at a slightly slower pace.
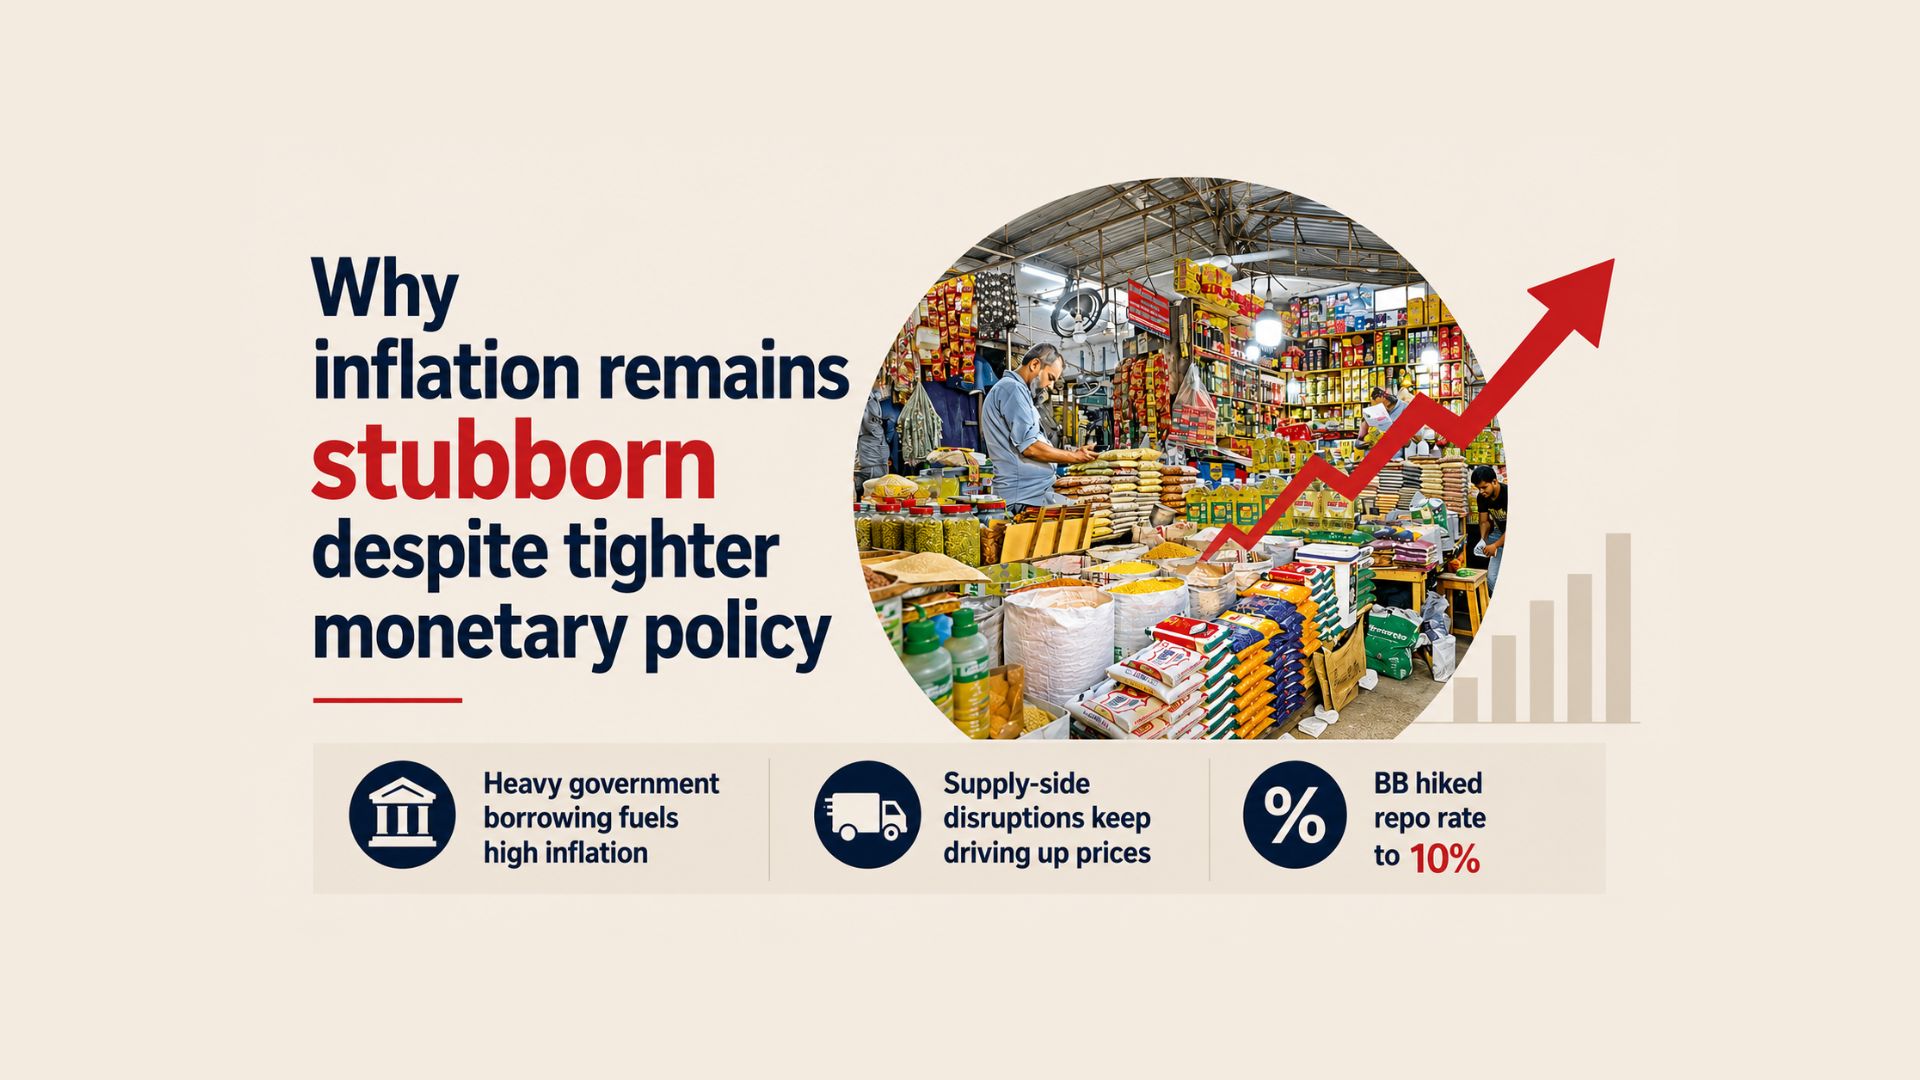
In fact, the government’s own underlying Consumer Price Index (CPI), which reflects the average change over time in the prices of a basket of commodities and services consumed by an average consumer, climbed.
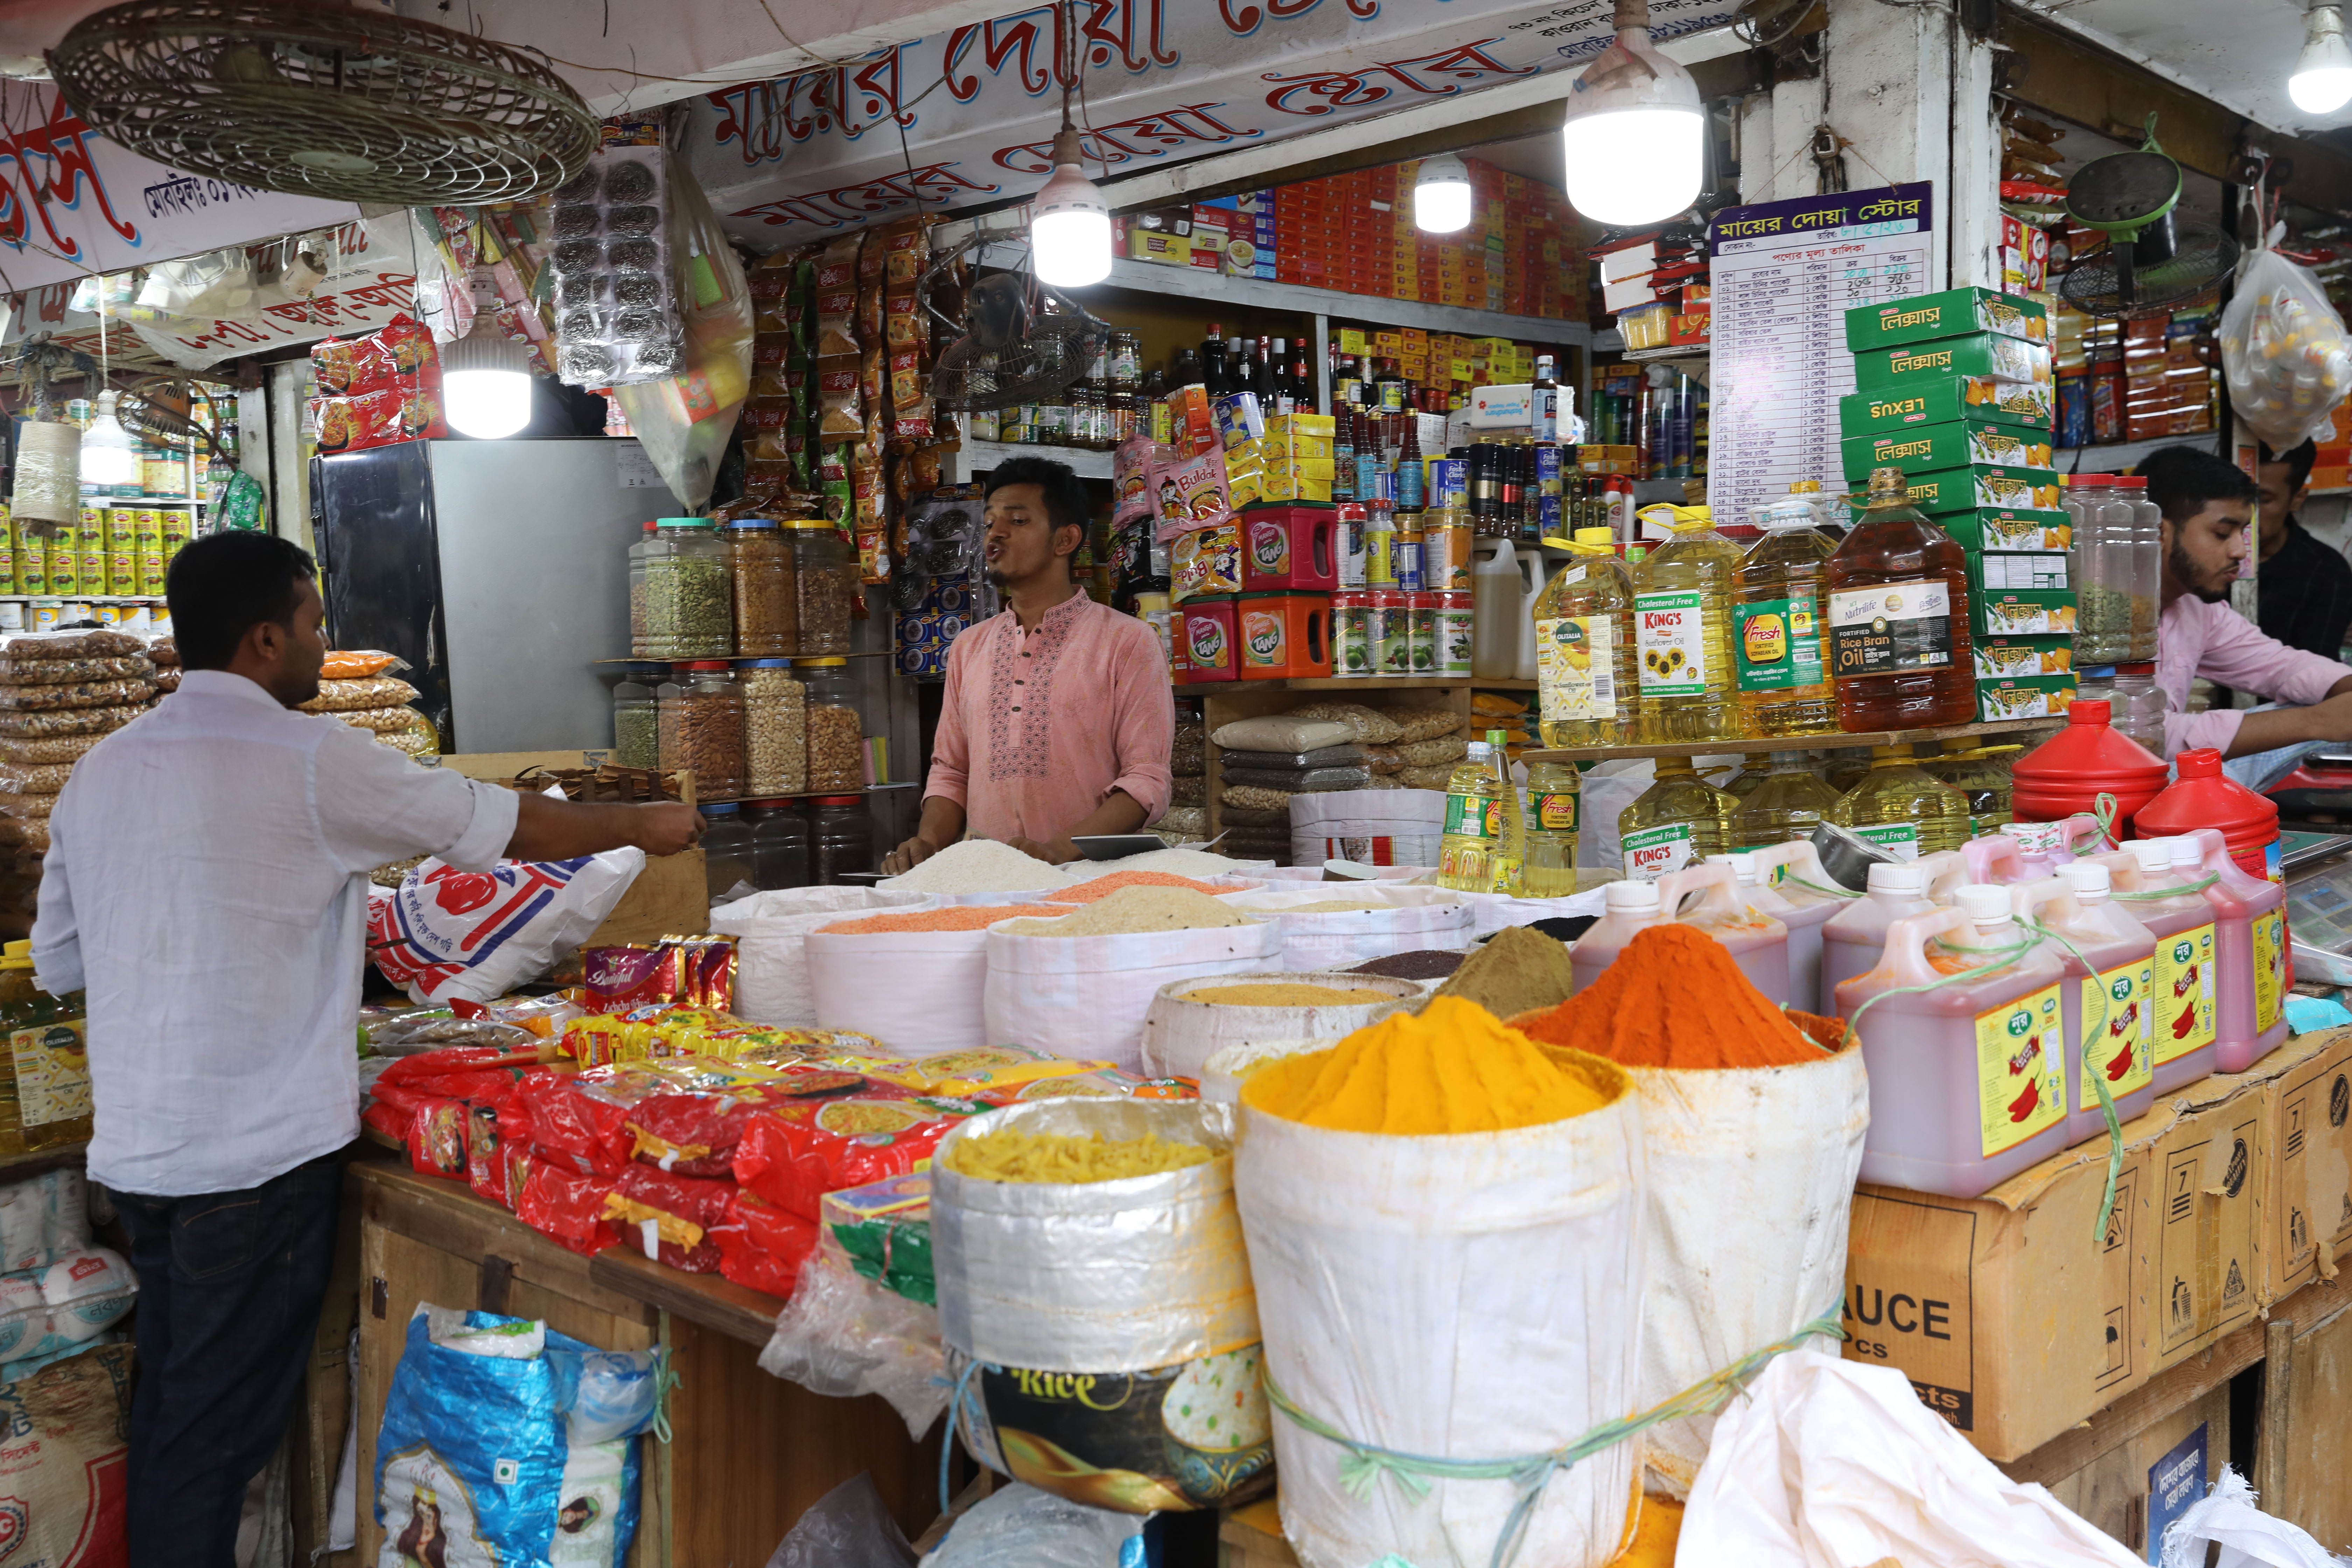
To compute the CPI or inflation, the BBS gathers price data of 383 items with 749 varieties of food and non-food items covering rural and urban areas.
The statistical agency said CPI rose from 146.11 in June to 148.21 in July. On a point-to-point scale comparison, the CPI was 136.83 in July 2025.
A year later, the index rose 11.38 points, showing a spike in the prices of the consumer basket. And from June to July this year, prices grew 1.44 percent, the highest spike since October last year.
So, to borrow a physical analogy, the car has tapped the brakes, but it is still rolling forward. Prices are still rising.
The perspective also changes depending on how you measure time. The celebrated 8.32 percent figure is a highly sensitive point-to-point comparison, measuring this July strictly against last July. But when you look at the 12-month average -- a smoother metric that filters out month-to-month statistical noise -- the rate sits higher at 8.66 percent. This longer view suggests that the underlying economic strain is far more stubborn than a single month's optimistic snapshot implies.
The data reveals a broad, albeit uneven, cooling of inflationary pressures across several core non-food sectors in July. While transportation inflation showed signs of easing, dropping to 9.34 percent in July from 10.10 percent in June, it remains uncomfortably close to double digits. This stickiness highlights the ongoing impact of broader macroeconomic factors and energy dynamics on domestic transit costs. Conversely, the most significant deceleration occurred in the communication sector, where point-to-point inflation plummeted from 9.76 percent in June to 6.90 percent in July. Recreation and culture experienced a similar contraction.
In fact, the CPI basket reveals severe and compounding price pressures in some areas, particularly within the service industry. The hospitality sector is actively defying the broader cooling trend, with point-to-point inflation for restaurants and hotels accelerating to 12.57 percent in July from 11.70 percent in June. Compounding this concern is a sharp month-over-month inflation spike of 1.61 percent in July, indicating that businesses are rapidly passing escalating operational costs directly to consumers.
Furthermore, the "Miscellaneous Goods and Services" category remains a significant pain point. Although its point-to-point inflation rate saw a marginal decrease to 14.49 percent in July, down from 14.98 percent in June, it continues to register as the highest inflationary category in the non-food basket.
While this represents a welcome step down from the alarming 18.90 percent peak observed in the 2025-26 fiscal year average, prices across this broad category remain severely inflated for the average consumer.
The most revealing detail is buried within the government’s own release, and it completely validates the public's frustration. Alongside the inflation report, officials noted that national wages grew by only 8.22 percent. Because this wage growth sits strictly below the 8.32 percent inflation rate, people’s real purchasing power continues to shrink. Your money is buying less than it did a year ago because your paycheck is simply losing the race against the cost of living.
This is the ultimate truth of the July report. The official math may very well be accurate in showing a genuine slowdown in rising costs. But when wages are falling behind, and the detailed item-level data remains hidden from public scrutiny, a mathematical "improvement" on paper will always feel like a crisis in real life.
 For all latest news, follow The Daily Star's Google News channel.
Comments